
Psychrometrics is the study of thermodynamic properties of moist air mixtures, and it forms the scientific foundation for every HVAC heating, cooling, humidification, and dehumidification process. HVAC psychrometrics explained in practical terms means understanding how dry-bulb temperature, humidity ratio, enthalpy, and dew point interact to define the exact state of air at any point in a system. For engineers and building designers, this knowledge is not theoretical background. It directly determines whether a coil is sized correctly, whether a space will develop mold, and whether an energy model reflects reality. The psychrometric chart is the primary tool for this analysis, and mastering it separates competent HVAC design from guesswork.
What are the key psychrometric properties in HVAC analysis?
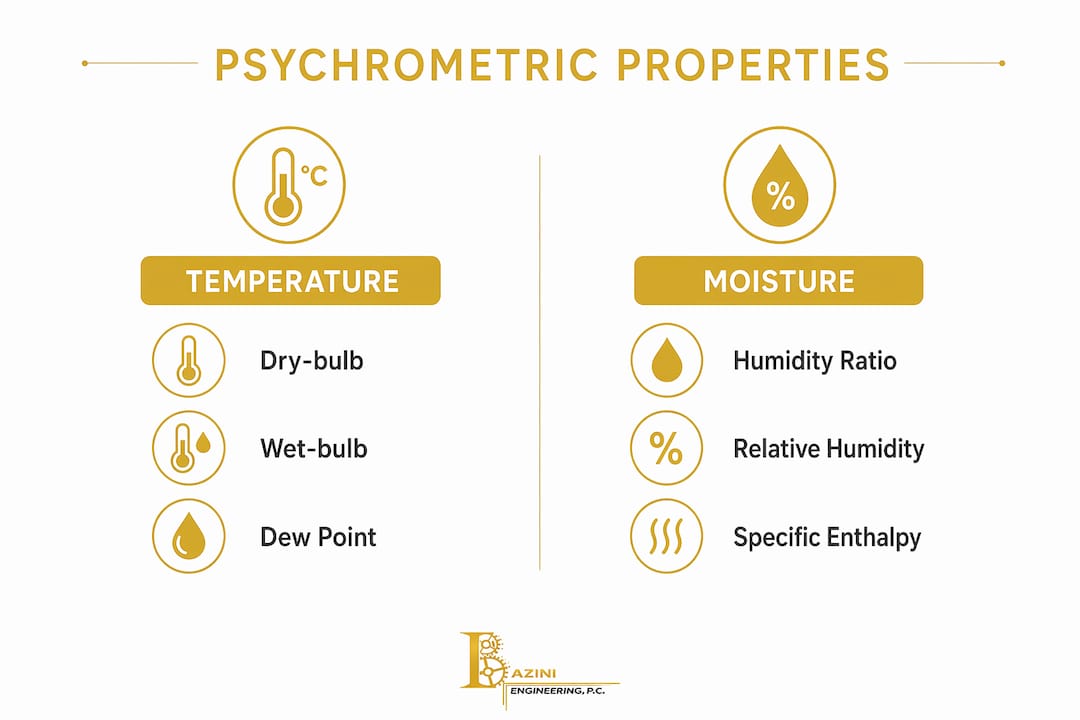
Every air state in an HVAC system is defined by a set of measurable properties. Understanding each one precisely prevents the calculation errors that lead to undersized equipment or chronic comfort complaints.
Dry-bulb temperature (DBT) is the standard air temperature measured by a thermometer shielded from radiation. It represents sensible heat content and is the horizontal axis on most psychrometric charts.

Wet-bulb temperature (WBT) reflects the cooling effect of evaporation. It is measured with a wetted wick over a thermometer bulb. Wet-bulb temperature is critical for evaluating cooling tower performance and outdoor design conditions.
Humidity ratio (W) is the mass of water vapor per unit mass of dry air, expressed in lb/lb or kg/kg. This is the preferred metric for engineering calculations because humidity ratio clarifies differences that relative humidity obscures. Two air samples at the same relative humidity but different temperatures carry entirely different amounts of moisture. Coil sizing and latent load calculations must use humidity ratio, not relative humidity.
Relative humidity (RH) is a temperature-dependent ratio of actual vapor pressure to saturation vapor pressure. It is useful for occupant comfort assessment but not a direct measure of water content. Treating RH as a moisture quantity leads to systematic errors in equipment sizing.
Dew point temperature is the temperature at which air becomes saturated at constant pressure. It predicts condensation risk on surfaces like supply ducts, window frames, and cooling coils.
Specific enthalpy (h) quantifies total heat content as the sum of sensible and latent components. The standard formula is h = 1.006T + W(2501 + 1.86T), where T is dry-bulb temperature in degrees Celsius and W is humidity ratio. Enthalpy drives accurate load calculations because it captures both temperature change and moisture change in a single value.
| Property | Unit (SI) | Primary HVAC use |
|---|---|---|
| Dry-bulb temperature | °C | Sensible load calculation |
| Humidity ratio | kg/kg dry air | Latent load and coil sizing |
| Relative humidity | % | Occupant comfort assessment |
| Specific enthalpy | kJ/kg | Total energy load calculation |
| Dew point temperature | °C | Condensation risk evaluation |
Pro Tip: Always confirm which basis your software uses. Some tools express enthalpy per kg of dry air; others use per kg of moist air. Mixing these bases produces errors that are difficult to trace back to their source.
How to read and interpret a psychrometric chart for HVAC
The psychrometric chart is a graphical representation of all possible moist air states at a given atmospheric pressure, typically standard sea-level pressure of 101.325 kPa. Reading it systematically is a skill that pays dividends across every phase of HVAC design.
Follow this sequence when working with any psychrometric chart:
- Locate the dry-bulb temperature. Find the vertical line corresponding to your measured DBT on the horizontal axis. This is your starting column.
- Identify the wet-bulb or dew point line. Diagonal lines sloping down to the right represent constant wet-bulb temperatures. Horizontal lines represent constant humidity ratio and constant dew point.
- Find the state point. The intersection of your DBT line and the appropriate WBT or RH curve defines the complete air state. Every other property can be read directly from that point.
- Read humidity ratio. Project horizontally to the right axis to read W in grains per pound or kg/kg dry air.
- Read enthalpy. Project along the nearest constant-enthalpy line to the enthalpy scale on the upper left boundary.
- Trace the process path. Heating moves the state point horizontally to the right. Cooling and dehumidification moves it down and to the left toward the saturation curve. Humidification moves it upward at roughly constant DBT.
Analyzing air states across coils and airflow paths validates system operation and highlights latent load problems that temperature measurements alone cannot reveal. Engineers who think in process paths rather than isolated temperature values consistently produce better-performing designs.
| Process | Direction on chart | Properties that change |
|---|---|---|
| Sensible heating | Right along constant W | DBT, enthalpy increase |
| Cooling and dehumidification | Down and left toward saturation | DBT, W, enthalpy decrease |
| Adiabatic humidification | Up and left along WBT line | W increases, DBT decreases |
| Sensible cooling only | Left along constant W | DBT, enthalpy decrease |
Pro Tip: When evaluating an existing system in the field, plot both the entering and leaving air states on the chart before touching any controls. The process path tells you immediately whether the coil is performing sensible work, latent work, or both.
What practical steps use psychrometrics for load calculation and equipment sizing?
The two-state method is the standard approach for HVAC load calculation using psychrometric principles. You define the air state at two points, typically entering and leaving a coil or air handler, and calculate the energy and moisture exchange between them.
The two-state method enables calculation of sensible load, latent load, and total load from enthalpy and humidity ratio differences multiplied by airflow mass. Sensible load uses the DBT difference and specific heat of dry air. Latent load uses the humidity ratio difference and the latent heat of vaporization. Total load uses the enthalpy difference directly, which is why enthalpy is the preferred metric for coil selection.
Latent load can equal or surpass sensible load in humid climates like coastal New York or Florida. Designers who size equipment based on sensible load alone routinely deliver systems that maintain temperature but fail to control humidity. The result is spaces that feel clammy at 75°F and carry elevated mold risk.
Coil selection requires the sensible heat factor (SHF), which is the ratio of sensible load to total load. The apparatus dew point (ADP) is the effective coil surface temperature, and it determines the leaving air condition achievable at a given bypass factor. A coil with a high bypass factor cannot reach low dew point conditions regardless of its refrigerant temperature.
Common errors in this process include:
- Confusing IP and SI unit bases when pulling enthalpy values from software
- Using relative humidity instead of humidity ratio to estimate moisture loads
- Ignoring unit discipline errors between per-kg-dry-air and per-kg-moist-air bases
- Applying design-day psychrometric states to part-load conditions without adjustment
- Neglecting ventilation air latent load in high-occupancy spaces
What nuances in psychrometrics affect troubleshooting and indoor air quality?
Field troubleshooting with psychrometrics requires more than plotting design-day state points. Measurement uncertainty, airflow imbalances, and sensor placement all affect the accuracy of a psychrometric diagnosis.
Wet-bulb temperature near 35°C represents a threshold for severe heat stress because evaporative cooling becomes ineffective. This matters for HVAC designers specifying outdoor air intake conditions and for engineers evaluating mechanical room ventilation in summer. Systems designed without adequate wet-bulb margin create both comfort failures and safety risks.
Dew point monitoring is the most reliable indicator of condensation risk. A supply duct surface below the space dew point will accumulate moisture regardless of what the thermostat reads. Persistent condensation on duct surfaces or diffusers almost always points to a dew point problem, not a temperature problem.
Psychrometric analysis must accommodate sensor uncertainties and airflow variations. Relying solely on theoretical state points without verifying actual airflow rates risks an incorrect system assessment and missed latent load problems. (Source)
When evaluating coil underperformance, compare the measured leaving air state to the design state on the chart. A leaving condition that plots above the design point on the humidity ratio axis means the coil is not removing enough moisture. This could indicate low airflow, elevated entering humidity, refrigerant charge issues, or a coil that was undersized at the design stage. The chart makes the diagnosis visual and unambiguous.
For indoor air quality management, maintaining humidity ratio within the ASHRAE 55 comfort zone (roughly 0.004 to 0.012 kg/kg) prevents both mold growth at the high end and respiratory irritation at the low end. Relative humidity alone does not give you this control because it shifts with temperature changes throughout the day.
How do modern tools enhance psychrometric analysis for HVAC professionals?
Digital psychrometric calculators have replaced paper charts for most calculation work, but the underlying principles remain identical. Tools like NovaSolver's psychrometric chart calculator accept two independent input properties and return the complete air state, including enthalpy, humidity ratio, dew point, and specific volume. This eliminates manual interpolation errors and speeds up iterative coil selection.
The practical workflow for most engineers combines software calculation with field measurement. You calculate design state points in a tool, verify entering conditions with calibrated sensors in the field, and then plot both on the chart to assess deviation. When design and measured states diverge significantly, the chart shows exactly which properties are off and in which direction.
Pro Tip: Verify your psychrometric software against ASHRAE Fundamentals handbook values at a few known state points before using it for equipment selection. Some free tools use simplified equations that introduce meaningful errors at extreme temperature or humidity conditions.
Limitations of digital tools include reduced accuracy at high altitudes where atmospheric pressure departs significantly from sea level, and at very low temperatures where frost formation changes the thermodynamic relationships. For projects in Denver, Colorado or high-elevation mechanical penthouses, use altitude-corrected psychrometric data or ASHRAE's altitude correction factors explicitly.
Integrating psychrometric software with sustainable MEP design workflows allows engineers to model energy recovery ventilator performance, evaluate enthalpy wheel effectiveness, and optimize outside air economizer controls with quantitative precision rather than rule-of-thumb estimates.
Key takeaways
Accurate HVAC psychrometrics requires humidity ratio, enthalpy, and verified airflow data working together. Relative humidity alone is insufficient for engineering decisions.
| Point | Details |
|---|---|
| Use humidity ratio, not RH | Humidity ratio is the correct metric for coil sizing and latent load calculations. |
| Enthalpy drives load calculations | Total load equals the enthalpy difference multiplied by mass airflow rate. |
| Two-state method is standard practice | Define entering and leaving air states to calculate sensible, latent, and total loads. |
| Dew point predicts condensation risk | Surface temperatures below space dew point will accumulate moisture regardless of thermostat setting. |
| Verify airflow before diagnosing | Theoretical state points without measured airflow data produce unreliable system assessments. |
Why psychrometrics is the skill most HVAC engineers underinvest in
I have reviewed HVAC designs where the equipment schedule was technically correct but the system failed within the first summer. In every case, the root cause traced back to a latent load that was estimated rather than calculated. The designer knew the dry-bulb temperatures. Nobody had plotted the process path.
The uncomfortable truth about psychrometrics is that it is taught as a topic in engineering programs but rarely practiced as a discipline in the field. Most engineers can identify a psychrometric chart. Far fewer can look at a coil's entering and leaving conditions, plot them, and immediately read whether the sensible heat factor matches the design intent. That gap is where comfort complaints and energy overruns originate.
What I have found actually works is treating the psychrometric chart as a diagnostic instrument rather than a design artifact. On every MEP project at Baziniengineering, we use psychrometric state analysis during design review, not just during initial sizing. When a mechanical contractor reports that a space "won't cool down," the first question is always: what are the entering and leaving wet-bulb temperatures across the coil? That single data point tells you more than an hour of troubleshooting by feel.
The other pattern worth naming is the unit discipline problem. Engineers working across IP and SI systems, or pulling data from multiple software tools, routinely mix enthalpy bases without realizing it. The budget MEP planning phase is the right time to standardize units across the project team. Fixing a unit error after equipment is ordered is expensive. Fixing it on a chart takes thirty seconds.
— Joseph
Work with engineers who apply psychrometrics from day one

At Baziniengineering, psychrometric analysis is integrated into every HVAC design from the first load calculation through final equipment selection. The firm's MEP engineers apply two-state coil analysis, latent load verification, and dew point risk assessment on commercial, residential, and institutional projects across New York City, Long Island, and Florida. If your project requires HVAC design that accounts for real moisture loads rather than assumed ones, contact Bazini Engineering to discuss your building's specific requirements. The difference between a system that performs and one that generates callbacks starts at the psychrometric chart.
FAQ
What is psychrometrics in HVAC?
Psychrometrics is the study of thermodynamic properties of moist air, including dry-bulb temperature, humidity ratio, enthalpy, and dew point. HVAC engineers use these properties to design and analyze heating, cooling, humidification, and dehumidification systems.
Why is humidity ratio preferred over relative humidity for HVAC calculations?
Humidity ratio measures the actual mass of water vapor per unit mass of dry air, making it consistent across temperature changes. Relative humidity shifts with temperature, so two air samples at the same RH can carry very different moisture loads.
How do you use a psychrometric chart for coil sizing?
Plot the entering and leaving air state points on the chart, read the enthalpy and humidity ratio at each point, then multiply the differences by the mass airflow rate to calculate sensible, latent, and total loads. The sensible heat factor from this calculation drives coil selection.
What does dew point tell you in HVAC troubleshooting?
Dew point identifies the temperature at which condensation forms on surfaces. When supply duct or diffuser surfaces fall below the space dew point, moisture accumulates regardless of thermostat settings, signaling a latent load or airflow problem.
What are common psychrometric calculation errors in HVAC design?
The most frequent errors are using relative humidity instead of humidity ratio for moisture loads, mixing IP and SI enthalpy bases, and applying design-day state points to part-load conditions without adjustment.